Sunny Isles Beach Q3 Luxury Sales: 35 Transactions, $138.3 Million
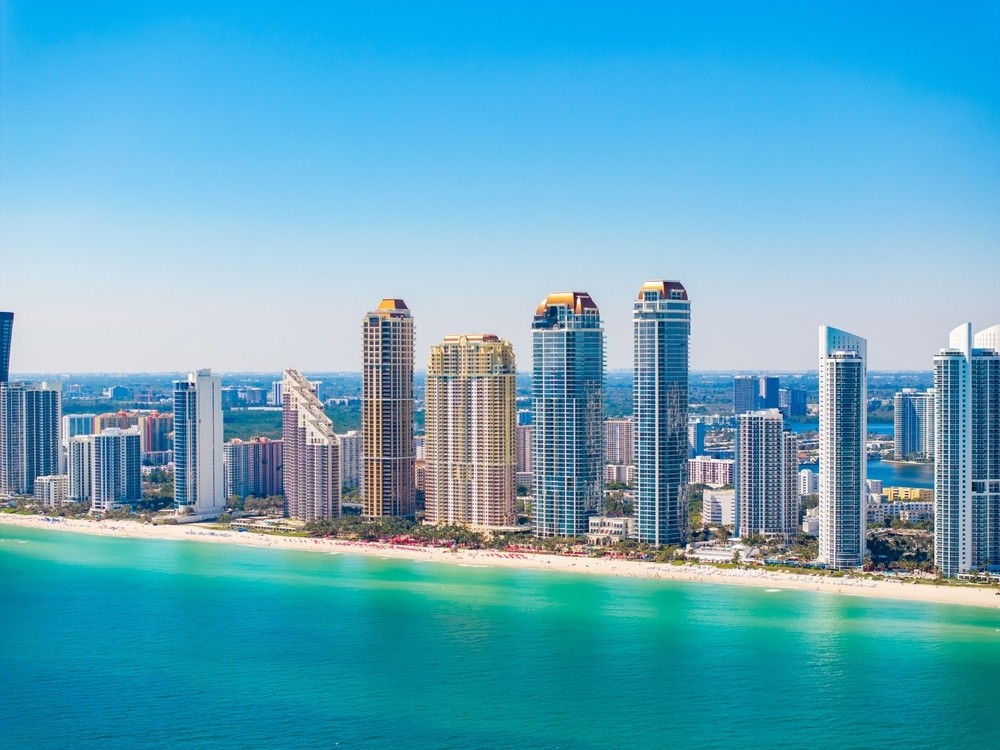
Sunny Isles Beach recorded 35 residential sales at $2 million or more in the third quarter of 2026, totaling $138,306,500 in the November 2 research refresh. The median recorded price was $3.5 million, while the average was approximately $3.95 million.
The refreshed count captures additional late-recorded deeds, lifting the research pack’s earlier tally from 31 to 35. It is a dated view of the supplied records, not a final count immune to later filings. Our full Sunny Isles Beach Q3 2026 luxury market report includes all 35 ranked sales, the separately dated listing snapshot and the methodology behind the figures.
Fewer transactions and lower dollar volume than Q2
Against the research pack’s Q2 baseline of 44 sales and $184.54 million, Q3’s recorded count fell 20.5% and volume declined 25.1%. The median moved from $3.6 million to $3.5 million, down 2.8%. Those Q2 figures are the supplied comparison baseline; the refreshed workbook contains the individual Q3 records, not the underlying Q2 sale ledger.
Average recorded price per square foot was $1,347, calculated as the simple mean of the 34 sales with usable size data. One implausible size value is withheld rather than treated as a verified property measurement. That average is not the same as dividing total volume by total square footage.
Condominiums account for most of the quarter
Condominiums made up 31 of the 35 sales, with $124,181,500 in recorded volume. Four single-family sales accounted for the remaining $14,125,000. Seven transactions reached at least $5 million; one exceeded $10 million.
The leading recorded sale was $11.4 million at 17901 Collins Avenue #5669, with 4,751 square feet in the supplied record, equivalent to approximately $2,399 per square foot. Its county recording date was July 2. The five highest-priced records were:
- 17901 Collins Avenue #5669: $11,400,000, recorded July 2.
- 17901 Collins Avenue #5675: $8,175,000, recorded August 31.
- 17749 Collins Avenue #4697: $7,000,000, recorded July 13.
- 17901 Collins Avenue #5676: $6,700,000, recorded September 1.
- 17749 Collins Avenue #4699: $6,500,000, recorded September 3.
Unit designators are reproduced as supplied by the research records. Recording dates identify when deeds entered county records, not necessarily the dates buyers closed.
July led the recorded sales cadence
July contributed 14 sales and $58,049,000 in volume. August recorded 10 sales totaling $37,530,000, followed by 11 September sales totaling $42,727,500. These monthly totals follow county recording dates, so filing delays can shift the apparent cadence and later revisions can change the quarter.
The November 2 asking-price snapshot is a separate dataset
The supplied November 2 listing snapshot contains 30 properties asking at least $2 million, with $155,853,500 in aggregate asking value and a median ask of $3,775,000. It includes 27 condominiums, one single-family property and two lots. The highest supplied ask is $12.2 million at 19575 Collins Avenue, Unit 33.
This listing sample uses the research pack’s Collins Avenue and ZIP 33160 collection scope, including some North Miami Beach postal labels. It is not a certified count of every currently available property within city boundaries. Availability and pricing may have changed since capture.
Asking prices and recorded sale prices describe different populations at different times. The gap between them is not evidence of appreciation, a negotiated discount or a like-for-like change in value.
Read the complete report
The sales research uses an ATTOM-derived residential deed snapshot with county recording dates from July 1 through September 30, 2026 and a $2 million minimum. The full report keeps the recorded-sale series distinct from the November 2 for-sale research snapshot. Conflicting bathroom values and the implausible size record are withheld from the affected property fields.
Explore the complete Sunny Isles Beach Q3 2026 report for every ranked sale and listing in the supplied research pack. For broader context, visit our Sunny Isles Beach guide and Market Reports.
How to interpret the quarterly research
Why can a quarterly property report change after quarter-end?
Deeds may enter county records after the transaction closes. A later research refresh can therefore add records associated with the reporting period. A dated snapshot should not be read as a permanently final tally.
Does a lower transaction count prove that a particular condominium lost value?
No. A market-level count and median describe the properties in that research sample, not a repeat sale of the same condominium. The report does not establish a change in value for an individual home.
Can November asking prices show what Q3 buyers negotiated?
No. The November listing snapshot and the Q3 recorded-sale sample cover different properties and dates. Their price difference is not a measured negotiated discount or a like-for-like change in value.