South Florida Luxury Real Estate Market Data Report: Mid-Year 2026
South Florida’s luxury real estate market entered the second half of 2026 with a data picture that demands more precision than headlines can provide. The broad strokes — near-record transaction volume at the top end, sustained international demand, a branded development pipeline of historic scale — are real. But the nuances within the data matter far more for buyers making decisions in specific submarkets, at specific price tiers, with specific timelines. This report compiles the most current available market data across Miami-Dade, Broward, and Palm Beach counties, updated for mid-2026.
Headline Numbers: What the Data Shows
Ultra-luxury transaction volume: South Florida logged 361 sales above $10 million in 2025 — the second-highest annual total on record, trailing only 2021’s peak of 444. Through Q1 2026, that pace has held: Miami’s luxury condo market recorded 424 total sales in Q1 2026, up 15.2% compared to Q1 2025 and up 25.4% versus Q4 2025 — the highest first-quarter sales volume outside the pandemic boom years of 2021 and 2022.
Price per square foot — Q1 2026 by submarket:
- Fisher Island: approximately $2,708 PSF (highest in Miami-Dade; Q3 2025 data, most recent available)
- Surfside: approximately $3,006 average sold price per transaction (Q2 2026)
- South Beach: approximately $1,538 PSF (up 37% year-over-year from Q3 2024)
- Miami Beach overall: approximately $1,292 PSF (Q3 2025), up 15.1% year-over-year
- Brickell: approximately $950 PSF (record high, Q1 2026); pre-construction new development $1,200–$1,500 PSF
- Edgewater (pre-construction): approximately $800–$1,100 PSF
- Sunny Isles Beach (pre-construction): approximately $900–$1,400 PSF depending on oceanfront premium
- Greater Downtown: approximately $718–$730 PSF
- Coconut Grove/Coral Gables: highest year-over-year price gain at 9.2% in Q1 2026
Luxury condo median metrics — Q1 2026:
- Miami luxury condo ($2M+) sales: 204 closings in Q1 2026, up 25.9% year-over-year
- Median price per square foot: $1,040 (Q1 2026), reflecting a 3.7% year-over-year decline from peak but stabilizing above the $1,000/PSF threshold
- Median sale price: up 2.3% year-over-year despite the PSF softening — indicating buyers are moving into larger units
- Days on market: 93 days median in Q1 2026, up 13.4% from 82 days in Q1 2025 — more time for buyer due diligence without losing access to deals
- Edgewater: 120% year-over-year surge in closed sales (44 closings Q1 2026 vs. 20 in Q1 2025) — the standout growth submarket of Q1
The Two-Speed Market Buyers Need to Understand
The single most important analytical distinction in South Florida’s 2026 luxury market is the split between best-in-class product and average inventory. These are not two segments of the same market — they behave as separate markets, with different absorption rates, different buyer profiles, and different value dynamics.
Best-in-class product — branded residences, boutique buildings with low unit counts, irreplaceable oceanfront or bayfront sites — continues to clear with conviction. Pre-construction absorption in branded product under $3 million has been running at 90–130 days from listing to binding contract. Above $5 million, the absorption window extends to 180–260 days, but the sales are happening.
Average inventory — non-branded resale condos, older buildings without reserve funding, buildings with high investor-rental ratios — is where the buyer’s market dynamic is most visible. Resale inventory sits at approximately 17 months of supply in some segments, compared to tight conditions in the pre-construction pipeline. Sellers in this category are accepting price adjustments; buyers have more leverage on terms than at any point since 2020.
The practical implication: if you are buying branded new development at a well-capitalized project, you are in a seller’s market. If you are buying resale in a non-branded building, you are in a buyer’s market. South Florida in 2026 is both, simultaneously, depending on exactly what you are buying.
Cash Buyer Dominance: What the Numbers Mean
South Florida’s luxury market is uniquely insulated from interest rate cycles because of its extraordinary cash buyer concentration. The data:
- Approximately 40% of all Miami home sales are all-cash, versus roughly 27% nationally
- At the $10M+ tier, an estimated 80%+ of sales involve no financing
- In Palm Beach County, approximately 56.5% of condo purchases and 41.4% of single-family purchases closed all-cash in late 2025
- International buyers — who overwhelmingly purchase cash — accounted for approximately 49% of new construction and pre-construction condo sales over the 18-month period ending June 2025
- Foreign buyer activity in South Florida reached $4.4 billion in the most recent measured period, a 42% annual increase
The 30-year fixed mortgage rate was projected at approximately 6.3% average for 2026, with a forecast decline toward 5.8% by year-end (Miami Realtors Association). For luxury buyers, this matters primarily for opportunity cost calculations and refinancing strategy — not for purchase feasibility, since most transactions in this tier do not involve conventional financing.
West Palm Beach: The Fastest-Growing Luxury Market in the United States
West Palm Beach is the data story of South Florida’s current cycle. According to a Redfin analysis of the 50 largest U.S. metros, luxury home prices in West Palm Beach surged 187.3% from October 2015 to October 2025 — the fastest decade-long appreciation of any major U.S. metro, more than double the national average increase of 82.5%. The median luxury home price reached $4.04 million as of October 2025 and climbed to approximately $4.2 million by January 2026, up 10.7% year-over-year.
For context: Miami ranked fifth nationally in the same Redfin analysis with 148% decade-long luxury appreciation. West Palm Beach’s 187% makes it, by data, the country’s single strongest luxury appreciation market over the past decade — ahead of every California market, ahead of Manhattan, ahead of every other U.S. metro.
The branded development pipeline — Mandarin Oriental WPB, Ritz-Carlton WPB, Banyan Tree WPB, Mr. C WPB, South Flagler House — is arriving precisely as this appreciation trajectory has become nationally visible. Buyers who entered the West Palm Beach branded market at 2022–2023 contract pricing are underwriting significant unrealized appreciation ahead of their 2026–2028 deliveries.
Palm Beach Island: The Most Constrained Market in Florida
Palm Beach island’s data operates in a different category from every other South Florida submarket. Key metrics:
- Median single-family sale price: $12.9 million (mid-2025)
- Average home value: approximately $9.8 million (as of late 2025)
- Five-year price appreciation: 118.2% — highest of any major Florida city
- In the first half of 2025, nearly 70% of all single-family transactions on the island closed above $10 million
- Total single-family transaction volume: exceeded $2.1 billion in 2025
- The 2025 island price record: a waterfront estate on Old Harbour Road that closed at $97.5 million
Palm Beach island is not directly comparable to any other South Florida market. It is 3.9 square miles of incorporated barrier island, zoned to maintain its low-density character, with a billionaire resident count (approximately 58) that is itself a market signal. The supply constraint here is not cyclical — it is structural and permanent.
Miami Pre-Construction: Q1 2026 Pricing Snapshot
Miami-Dade pre-construction reservation volume ran 14% above Q4 2025 in Q1 2026, with branded product outperforming non-branded by 11–18% on price per square foot. Key pricing tiers for active new development projects:
- Brickell pre-construction: $1,200–$1,500 PSF (new luxury; Cipriani Residences, St. Regis Brickell)
- Edgewater pre-construction: $800–$1,100 PSF
- Sunny Isles Beach pre-construction: $900–$1,400 PSF (oceanfront commands the top end)
- Coconut Grove pre-construction: Four Seasons at $7M–$17M per unit; THE WELL from $1.5M
- Design District: Fouquet’s and Jean-Georges targeting $3M+ entry
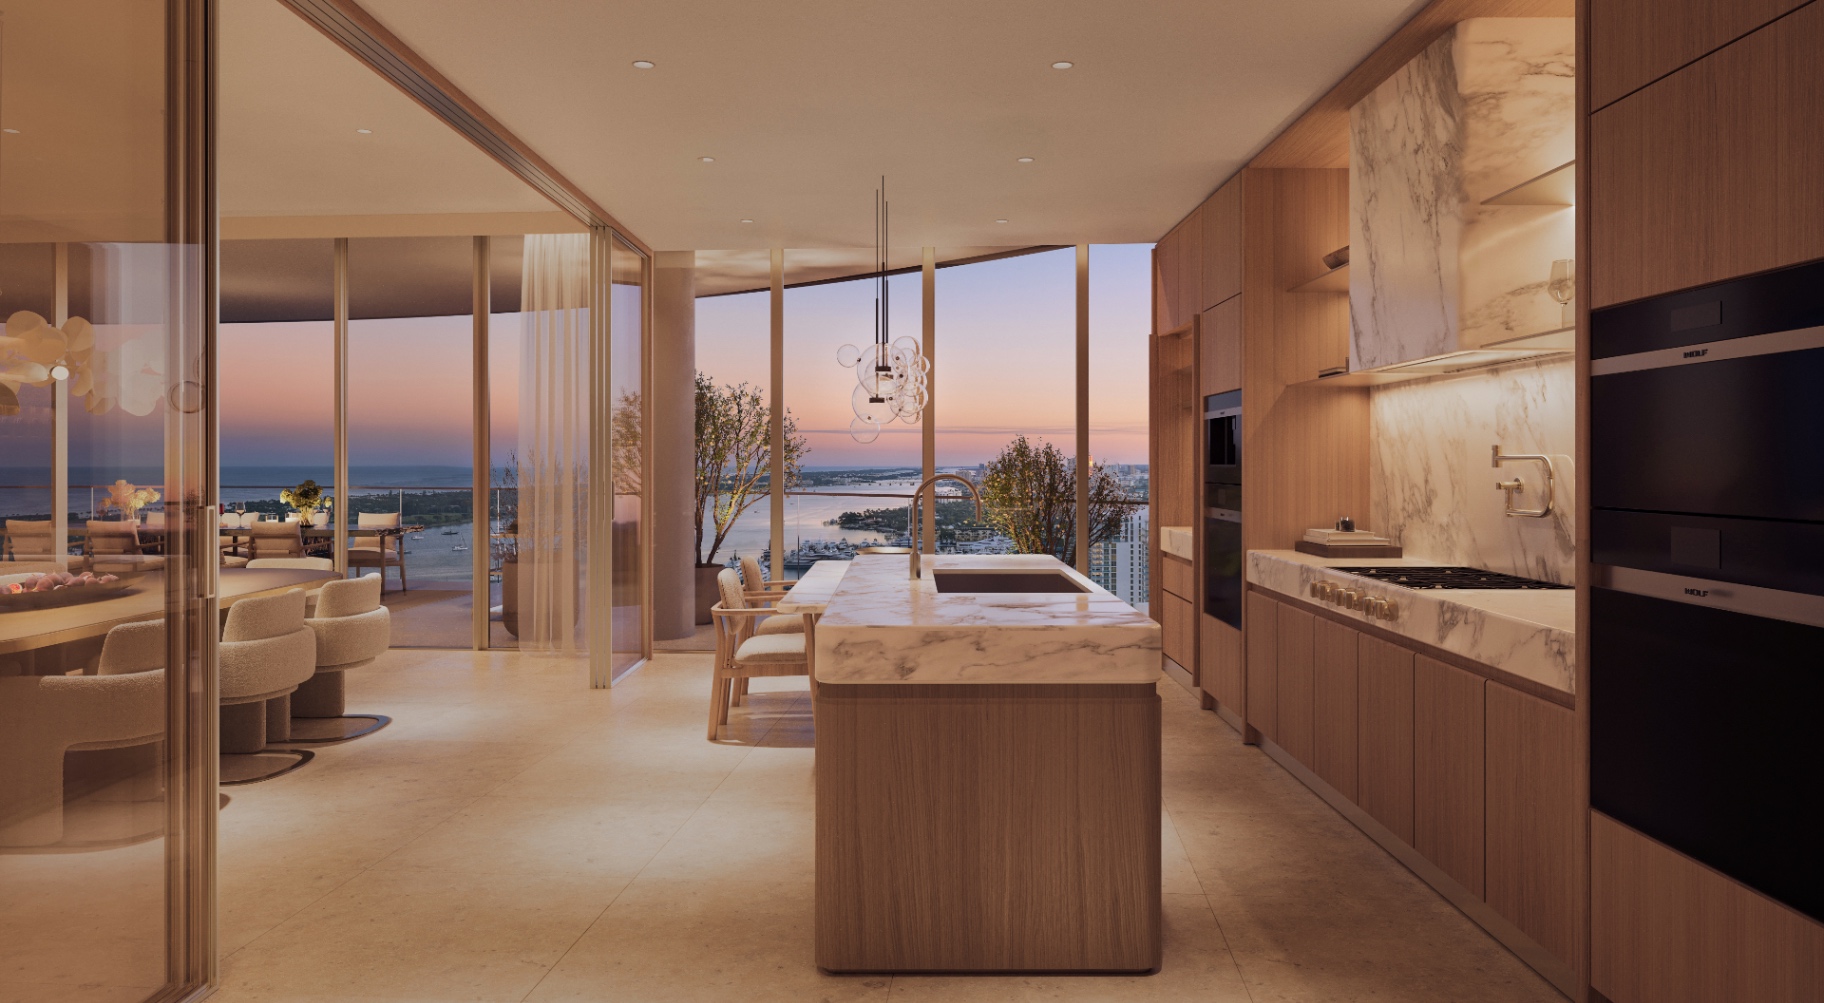
The outlook for pre-construction pricing through Q4 2026 is continued appreciation in the range of 8–14% annually for branded product in well-located buildings. The appreciation runway before delivery — the spread between today’s pre-construction pricing and post-delivery comparable sales — is estimated at 10–15% for the best-positioned current projects.
What the Data Means for Buyers Entering the Market in H2 2026
Three strategic implications from the mid-year data:
Buy the submarket, not just the building. PSF spreads within Miami-Dade — from $730 at Greater Downtown to $2,708 at Fisher Island — are so wide that submarket selection matters more than building selection within a submarket. Buyers who understand which submarkets are repricing upward (Edgewater +120% sales volume, Coconut Grove +9.2% YoY price gain, West Palm Beach +10.7% luxury median YoY) are in a more advantaged position than buyers shopping by amenity list alone.
The 93-day median DOM is an opportunity, not a warning. Longer days on market in the resale segment give buyers time to conduct proper due diligence — structural inspection, HOA financial review, view corridor research — without losing the property. In 2021–2022, the same diligence was impossible in compressed 2-week decision windows. The current environment rewards disciplined buyers.
Pre-construction at well-capitalized branded projects remains the strongest appreciation play. The 14% above-Q4 2025 reservation volume in Q1 2026 suggests that sophisticated buyers recognize the remaining window to enter before post-delivery price resets. The spread between current pre-construction pricing and post-delivery comparables at buildings like Mandarin Oriental WPB, Banyan Tree WPB, and The Perigon is meaningfully positive — and narrows as construction progresses.
Need details on these residences?
Our advisory team can share current information on the projects referenced in this guide.
Speak With an Advisor →