

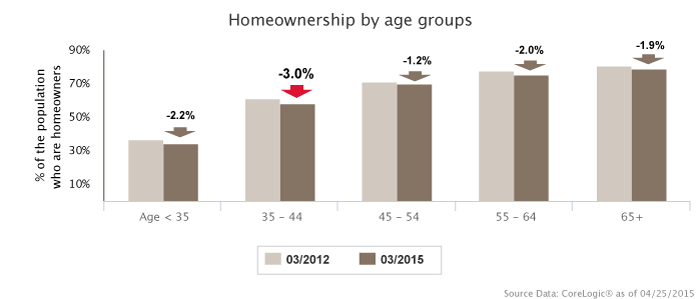
Data compared from March 2012 and March 2015 reveals homeownership has decreased across the board, but that the decline among 35-44 year olds is greater than in any other age group. Still struggling from the aftereffects of the Great Recession in 2008, everyone from young millennials to baby boomers are choosing to put off purchasing a home or are deciding to rent smaller spaces. The chart below demonstrates the percent decrease in home ownership among each age group.
Home ownership rates in each age group:
| Month | Age < 35 | 35–44 | 45–54 | 55–64 | 65+ |
| 03/2012 | 36.8% | 61.4% | 71.3% | 77.8% | 80.9% |
| 03/2015 | 34.6% | 58.4% | 70.1% | 75.8% | 79.0% |
| Change | -2.2% | -3.0% | -1.2% | -2.0% | -1.9% |
Home ownership rates and occupancy percentage of rental properties show a negative correlation–after all, people have to live somewhere! The consistent increase in rental occupancy over the past three years may come as good news to some. Because the inventory has stayed relatively constant, the increase in renters could help stabilize housing costs and make homes more affordable in the long run.
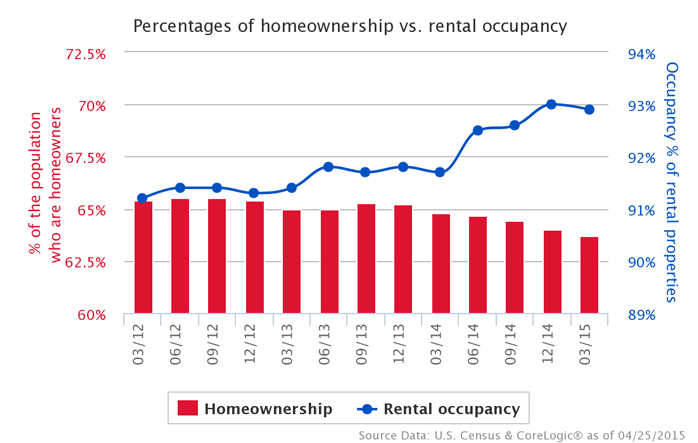
| Month | Homeownership | Rental occupancy | Inventory |
| Mar-12 | 65.4% | 91.2% | 987,674 |
| Jun-12 | 65.5% | 91.4% | 1,005,142 |
| Sep-12 | 65.5% | 91.4% | 942,397 |
| Dec-12 | 65.4% | 91.3% | 818,962 |
| Mar-13 | 65.0% | 91.4% | 854,883 |
| Jun-13 | 65.0% | 91.8% | 916,984 |
| Sep-13 | 65.3% | 91.7% | 914,422 |
| Dec-13 | 65.2% | 91.8% | 819,771 |
| Mar-14 | 64.8% | 91.7% | 882,375 |
| Jun-14 | 64.7% | 92.5% | 1,013,548 |
| Sep-14 | 64.4% | 92.6% | 1,005,148 |
| Dec-14 | 64.0% | 93.0% | 864,901 |
| Mar-15 | 63.7% | 92.9% | 773,770 |