 Photo Credit: Matthew Hernandez
At the time I was conducting research for this article, Coronavirus had yet to rear its ugly head. My 37 year real estate career has spanned several downturns and recoveries, including the 1980s oil and savings & loan collapse, the stock market crash of the later 1980’s, the tech bust & 9/11 attacks in the early 2000’s, and most recently, the mortgage meltdown and great recession of the late 2000’s. As of this writing no one knows how the Covid-19 pandemic will affect our lives. From a real estate market perspective, the answer to that question may not be known for months, if not years. What we have learned from history, however, is every market downturn has always been followed by a recovery.
I will continue to analyze the market and keeping my clients up to date on all its twists and turns, but for now I am providing my most recent analysis. Although it seems such a long time ago, 2019 real estate activity continued to improve in Steamboat Springs. But how did Steamboat compare to other top-tier western ski resorts? Here’s an interesting look at that question, with very informative and surprising results.
The Resorts
Ten resort areas, which include Steamboat, Aspen/Snowmass, Vail/Beaver Creek, Summit County, CO (Breckenridge/Keystone/Copper Mtn), Summit County, UT (Park City/Deer Valley/Canyons), Telluride, Crested Butte, Big Sky, Jackson Hole and North Lake Tahoe (Lake Tahoe, Alpine Meadows, Squaw Valley, Northstar) were selected due to market similarities and historic data availability. One quick note about Park City’s data – it encompasses their entire MLS, which includes Summit and Wasatch Counties.
Average Price
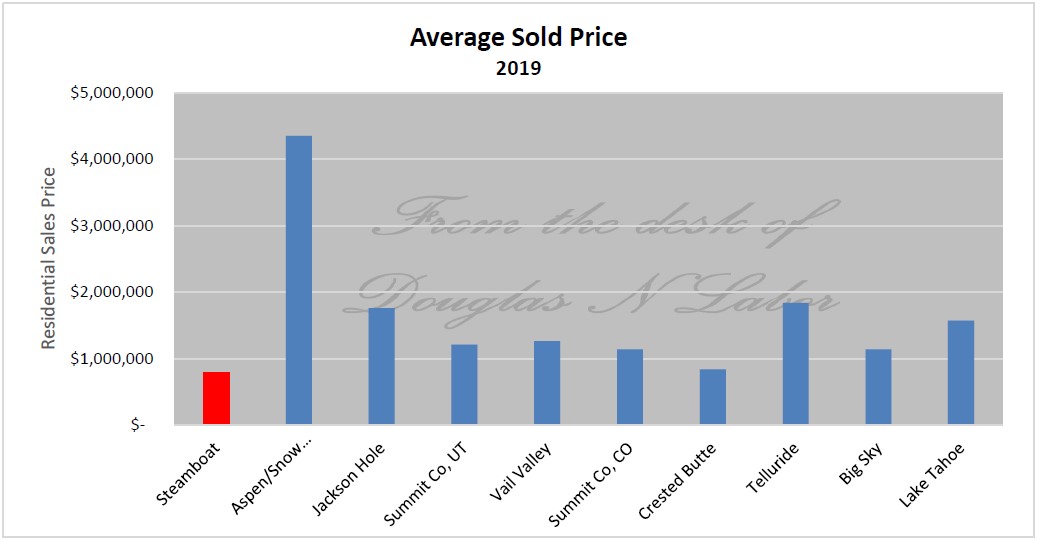 Photo Credit: Doug Labor
At an Average Residential Sales Price of $792,524, Steamboat was the most affordable resort to buy property of the ten resorts in 2019. That increase was still a 10% improvement over 2018. Crested Butte, which jumped ahead of Steamboat, had the largest year-over-year increase at 26%. The average price for a residential property in Aspen fetched $4.345m, topping all other resorts. Telluride had the second greatest YOY gain, at 21% and posting an average price of $1.840m.
Dollar-per-Square Foot
 Photo Credit: Doug Labor
The benchmark many real estate professionals use to value property is dollar-per-square foot cost. This is a common denominator for property value and gives what a square foot would cost, no matter if the property is 1,000 square feet or 5,000 square feet, whether it is in Jacksonville or Jackson Hole. In 2019 the Average $/sf cost in Steamboat was $371, giving a 3,000sf house value of around $1.113 million. Aspen posted sales at $1,531/sf for the top spot with Telluride and Jackson Hole tying for second at $800/sf.
Days-on-Market
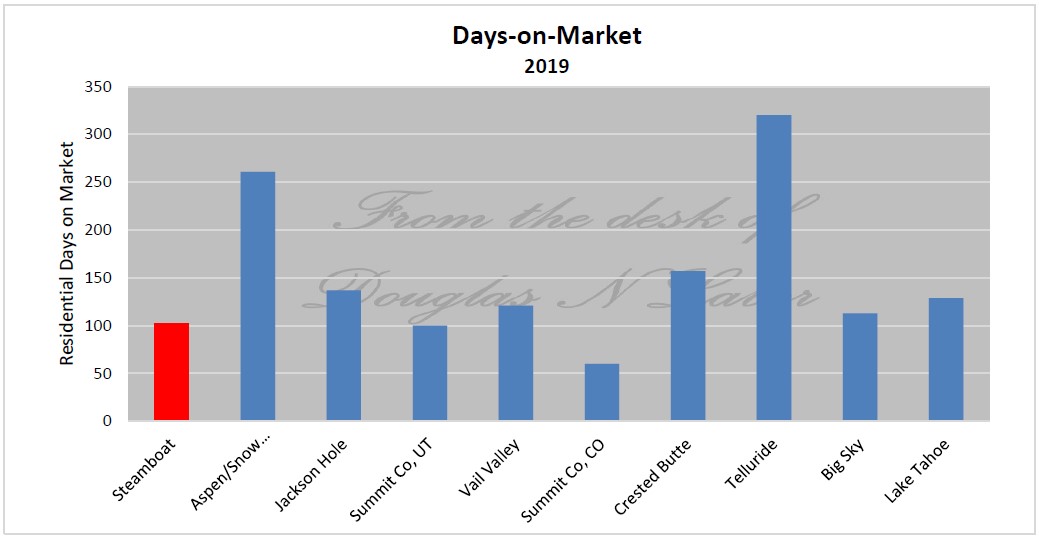 Photo Credit: Doug Labor
The time it takes a home to sell is an indication of market demand. It takes more days to sell a property in a market long in listings (supply) but short in buyers (demand), than one with fewer listings and more buyers. In 2019, it took only 60 days to sell a home in Breckenridge (highest demand), yet it took 320 for a home to sell in Telluride (lowest demand). Steamboat fared well in this category, with the third least amount of time for a property to sell (102 days). Park City was slightly better at 100 days.
A Comparative Analysis
After looking at these results, one must wonder which market performed the best in 2019? To answer this question, I compiled the past six years of market data from all 10 resorts in against their individual six-year average in six categories of residential sales. These categories are, in order of importance: Average Dollar-per-Square Foot (10), Days on Market (8), Average Sales Price (6), Annual Transactions (4), Sales:List Price Percentage (2), and Dollar Volume (1). Because these categories are more meaningful than others, they have ‘weighted values’. For instance, Dollar-per-Square Foot (i.e. are values increasing or decreasing?) is more telling of market health than mere Dollar Volume. Therefore, each category is given a weighted value (in parenthesis above). The weighted value will then be multiplied by the position the resort places in each category. First place receives 10 points, second place 9, and so on, with the last place resort will have a “1” place score, then multiplied by the weighted value for each category. Resorts will then be ranked based upon their total score.
And the Winner Is…
![]() Photo Credit: Doug Labor
Photo Credit: Doug Labor
With a potential of 310 total points, Montana’s Big Sky Resort outscored the competition with a total point value of 245, closely followed by Breckenridge (243) and Crested Butte (241). Steamboat took 6th place with 151.
What impaired Steamboat was its 8th place finish for $/SF. Although many Steamboat buyers feel square footage values are high, 2019 was only at 110% of its 6-year average, whereas values at Crested Butte (#1) and Summit County, CO (#2) jumped 131% and 130%, respectively. Steamboat took 3rd place in Sold:List Price %, where our six-year average was 96%; second only to Summit County, CO’s 97%. Steamboat placed in the middle on the other four categories. Finishing in the middle is not a bad thing. It shows most rudiments are in check. At year-end 2019, Steamboat remained one of the most affordable top-tier ski resort real estate markets in the Rocky Mountains, where all markets have enjoyed steady growth since the 2008 recession. However, as mentioned at the beginning, COVID-19 will most likely effect resorts differently. It will be interesting to conduct this same analysis a year from now to see what has changed.